


StoneShot Learning > Reporting > Visitor Tracking
Visitor Tracking
Our visitor tracking functionality, enables you to measure website activity – unlike standard web tracking, this allows you to view what an individual client is doing on the web site you’ve set up to track.
Typical use cases include:
- Measurement – you can measure the amount of traffic to the site and see which pages are attracting most engagement
- Lead scoring – you can assign points to certain page goals to increase contact lead scores; you can also assign points to individual product scores
- Sales insights – you can view a full history of each contact’s web activity in the same timeline as their email, event and video history in Salesforce
- Marketing automation – you can trigger emails, campaigns and alerts based on web activity e.g. invite a client to a webinar if they visit the fund page
In this page we’ll go through each section of the visitor tracking tool including how to add a site to be tracked.
Adding a site
When you first go on the Visitor Tracking page, you’ll need to click the green Start Tracking button in the centre of the page. Once you’ve clicked that, you’ll be taken to the below page where you can add the site you wish to track.
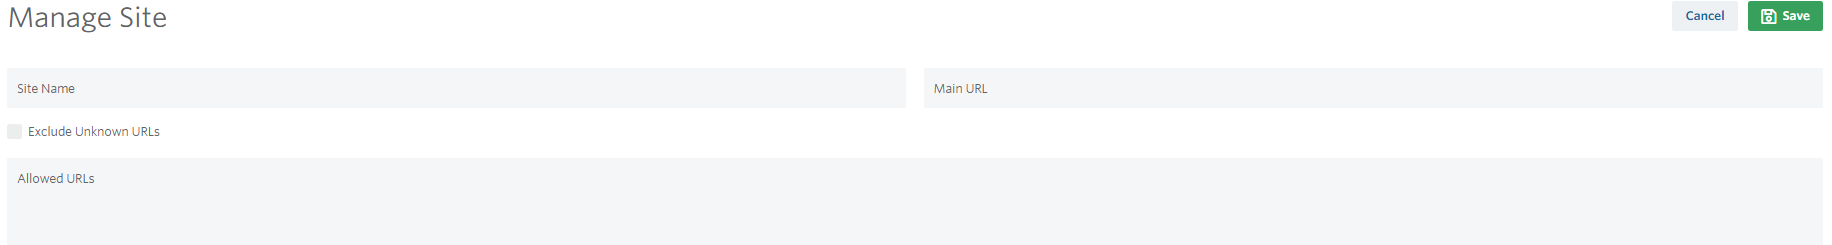
Site name – the name or URL for the site you wish to add. i.e. “Main site” or “StoneShot.com”
Main URL – in here you need to put the main URL of the site you wish to track.
Exclude Unknown URLs – when enabled, we will only track internal actions when the Page URL is one of the known URLs for your website. This prevents people from spamming your analytics with URLs for other websites.
Allowed URLs – in here you need to put the main site and any iterations of that site.
Below is an example of the completed page.
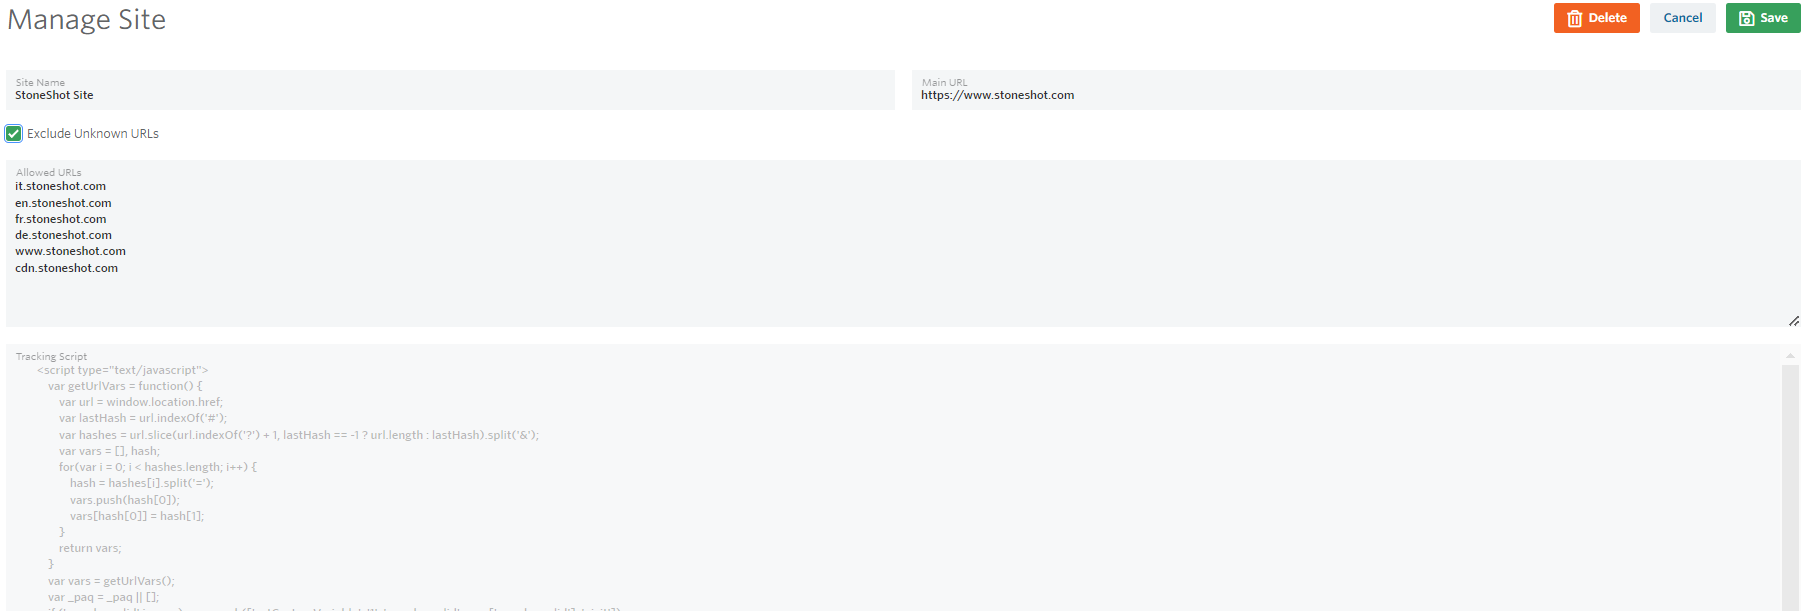
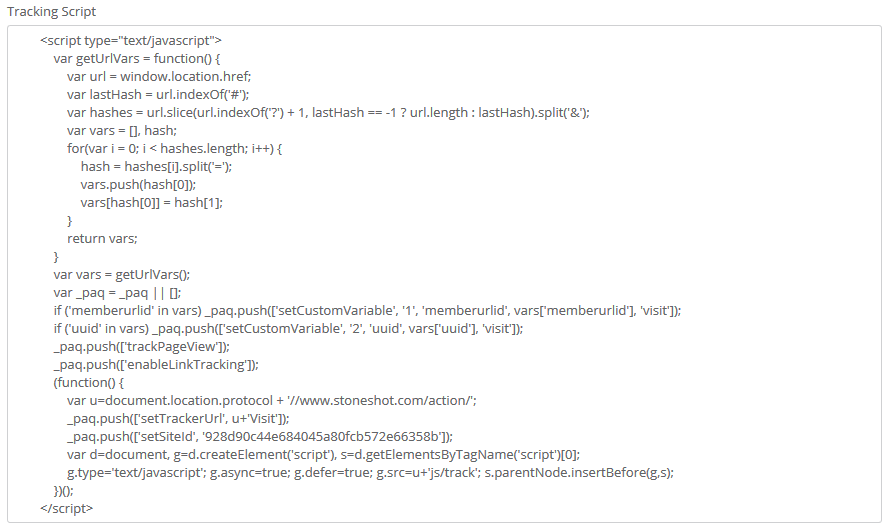
Once you’ve completed the page you’ll see the Tracking Script underneath, which will need to be pasted into the code of your website.
That’s it! Now that you’ve added a site, you can start tracking the page activity.
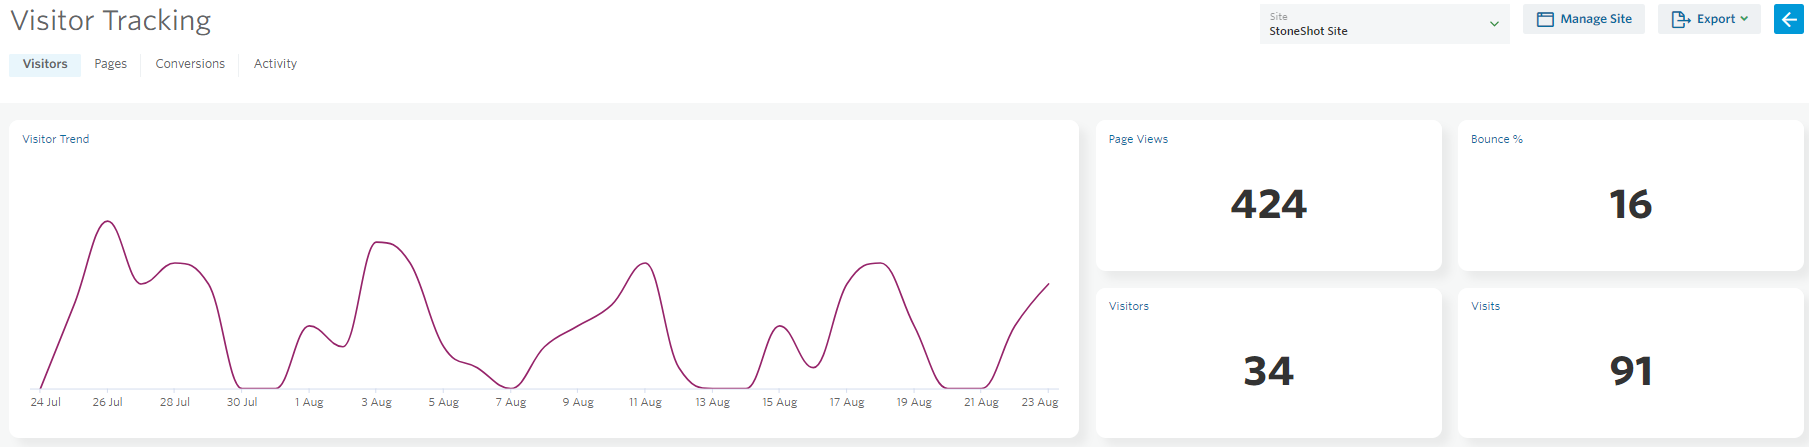
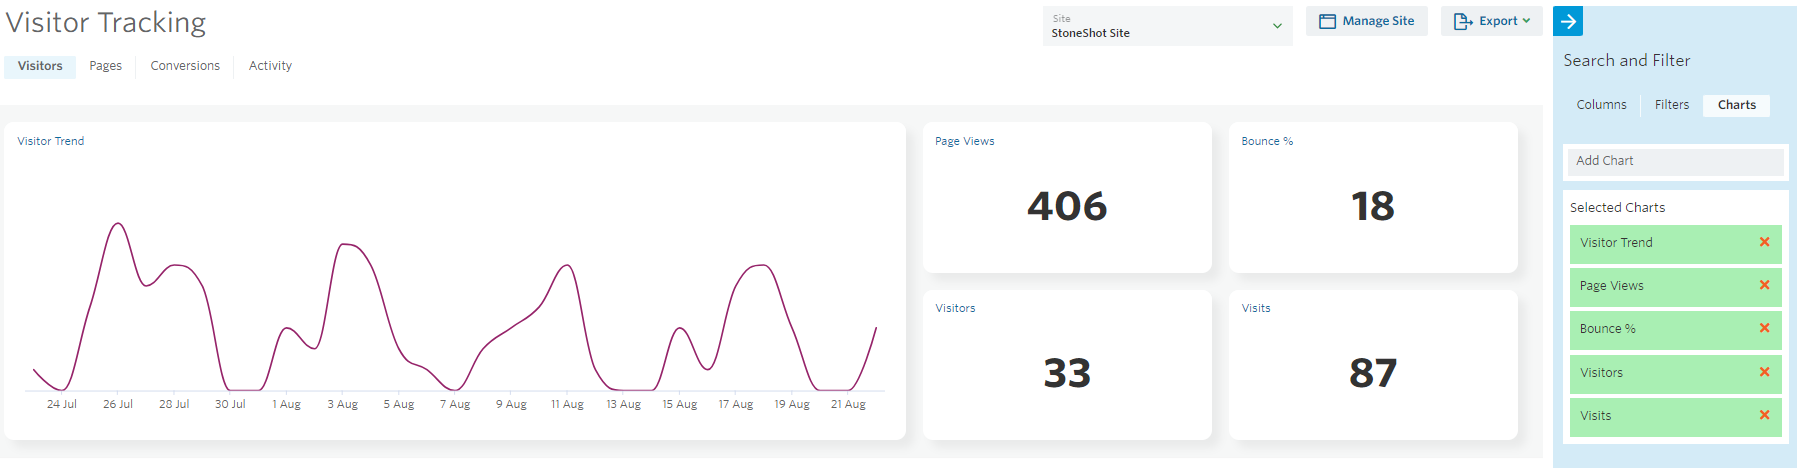
1. Visitors
In this section, you can see the visitor activity from page views, the location it was viewed, all the way to the screen resolution it was viewed on.
You can completely customise the information you’re seeing, by clicking the Edit button, in the top right.
In here you can add any additional charts, columns or filters to show the information you want to see.
Charts – this section will add or remove any additional charts to the top section of the page.
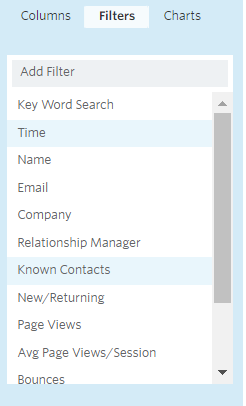
Filters – here you can find all the filter options, to show the relevant information in the tracking stats. Anything you select in here will update filters on the page.
Columns – the columns section lets you add and remove the columns you see in the bottom section of the visitors’ page.
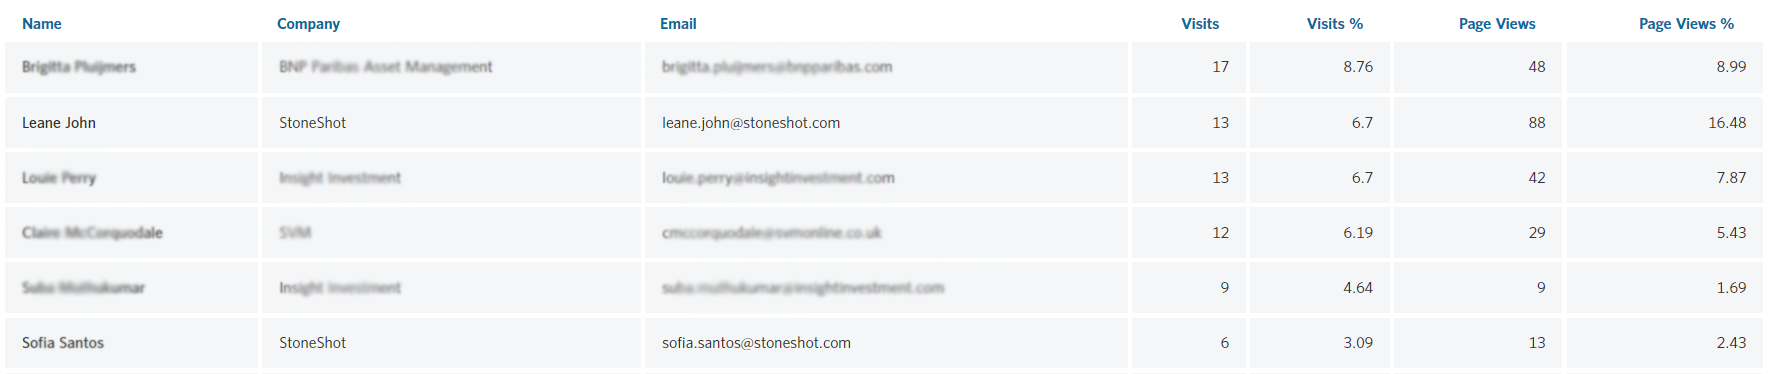
Each column will show the information you’ve selected from your filters.
Any of the information you see on this page can be exported, using the Export button in the top right of the page.
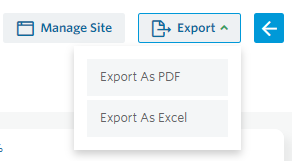
If you select Export As PDF, this will export the charts in the top section of the page. Selecting Export As Excel will export the columned stats, in the bottom section of the page.
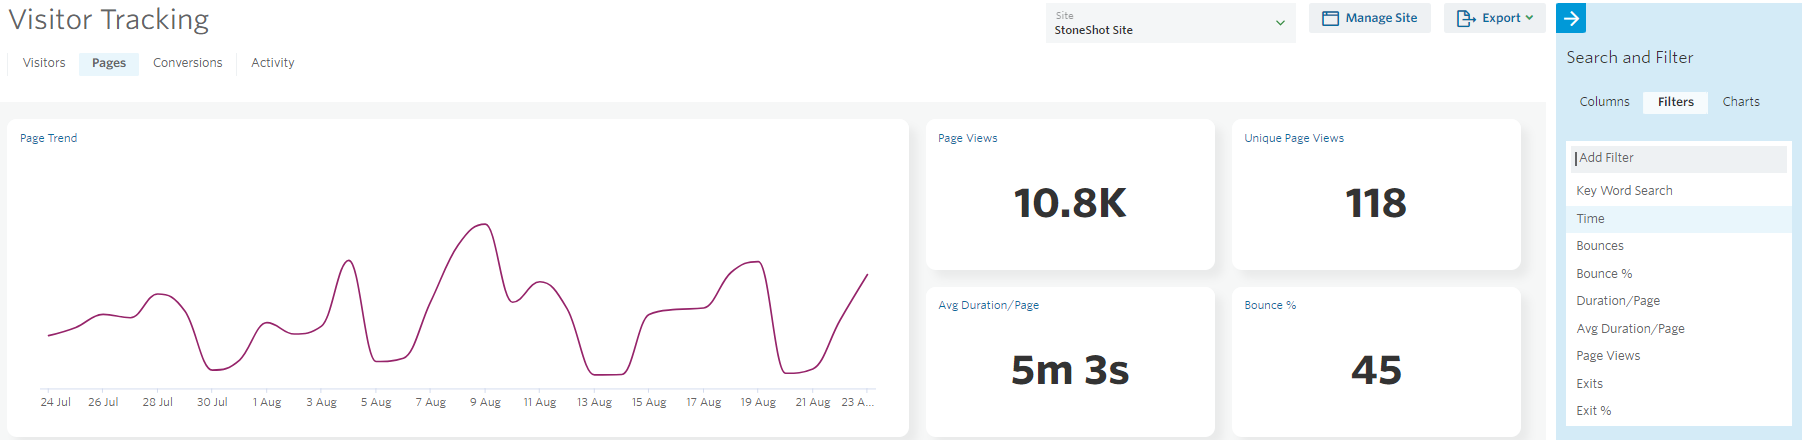
2. Pages
This page is very much like the Visitors page except this page shows the activity against each page of your site, rather than the general visitor stats.
Also, this page has slightly different filtering options, allowing you to filter down to get the relevant information.
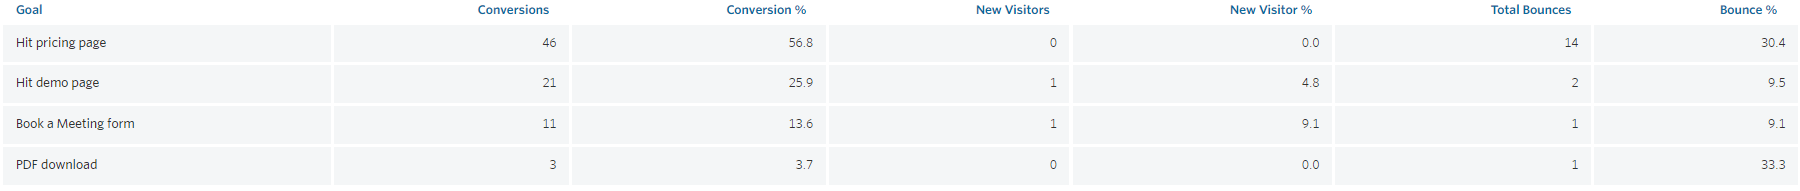
3. Conversions & Goals
As well as tracking all activity on the site, we can focus on specific pages that sales would be most interested in, so for this we can set up and identify “goals”, or conversions, that we can then use for lead scoring and marketing automation purposes. We would build out a site map and suggested tag strategy across the site, then “tag” those pages in StoneShot using the existing content and lead scoring tags.
Goals – in the visitor tracking tool, we can set up goals to link to your tagging strategy that you already have set up in StoneShot. So, whenever someone visits your site that has a goal of “Equities”, for example, the contact will gain a score, which will then be attributed to the “Equities” tag, allowing you to be able to report on the tag with site visits included.
Conversions – a conversion is someone who has met a goal. For example, if you set a goal as ‘Visit a page with “email-marketing” in the title’ and a client met that goal, this would be recorded as a conversion and will be shown towards your set goals, on the Conversions page.
4. Activity
The activity page gives you a breakdown of all activity against your site. Here you can see exactly who’s visited, the company they’ve visited from, all the way to the resolution of their screen.
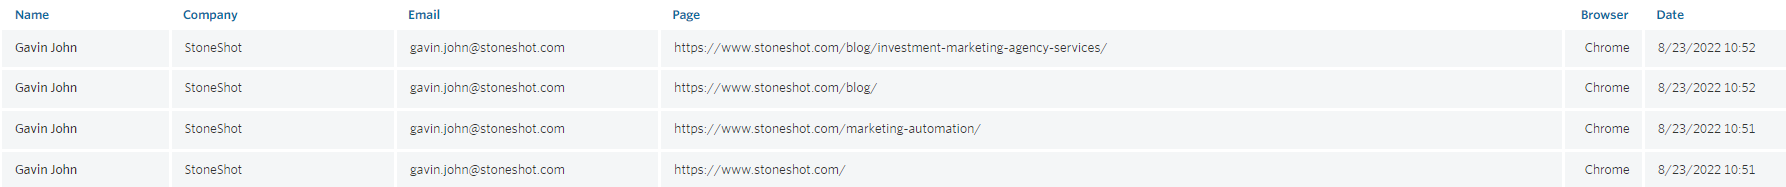
Like all pages in the visitor tracking tool, you can add filters, so you only see the information you’re after, as well as adding the relevant charts.
Setting up a goal
On the Conversions page, click the Add Goal button in the top right. This will take you to the below page, where we can set the details of our goal.
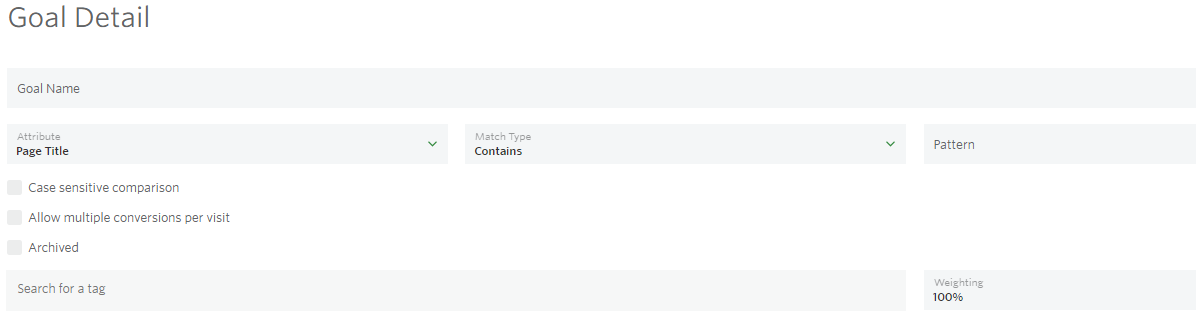
Here you can put in the relevant name of your goal. Once you’ve done that, you can select the Attribute, Match Type and Pattern.
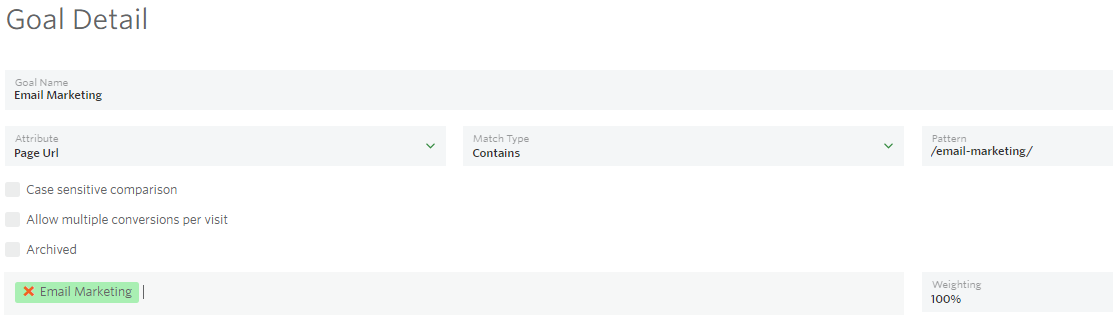
The below example has set the goal to mark a conversion whenever someone visits a page that has email-marketing in the URL. This has also been tagged with Email Marketing, which means the goal will also link to any reporting or analytics used against that tag.
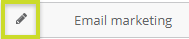
If you want to edit any of the goals you’ve set up, just click the pencil icon next to the goal you wish to edit.
Implementing a JavaScript goal conversion
It’s great to see that you’re ready to start tracking website activity. Tracking the behavioral patterns and engagement of your site visitors provides useful insight to enhance user experience and improve your marketing strategy.
To set up Visitor Tracking:
- Go to Reports > Visitor Tracking

- When you first go to the Visitor Tracking page, you’ll need to click the green Start Tracking button in the center of the page. If you already have a site set up and would like to add an additional site, then click the dropdown located in the top right and select + Add New Website.

- You’ll be taken to the Manage Site page where you can add the site you wish to track.
- Once you’ve finished and hit save, there will be Tracking Script displayed beneath the site information which will need to be pasted into the code of your website.


After adding the code snippet to your site, you can then set up your goals and conversions will start coming through to the StoneShot platform when goals are met.
To find out more about Visitor Tracking, take a look at our video below.