


StoneShot Learning > Reporting > Reporting Overview
Reporting Overview

StoneShot’s campaign reporting tool is a great way to know how your emails performed. You can check how many of your emails were opened, clicked through or even which devices are performing best.
To access your report, login to the StoneShot Marketing Platform and click Report > Campaigns.
Campaigns Dashboard
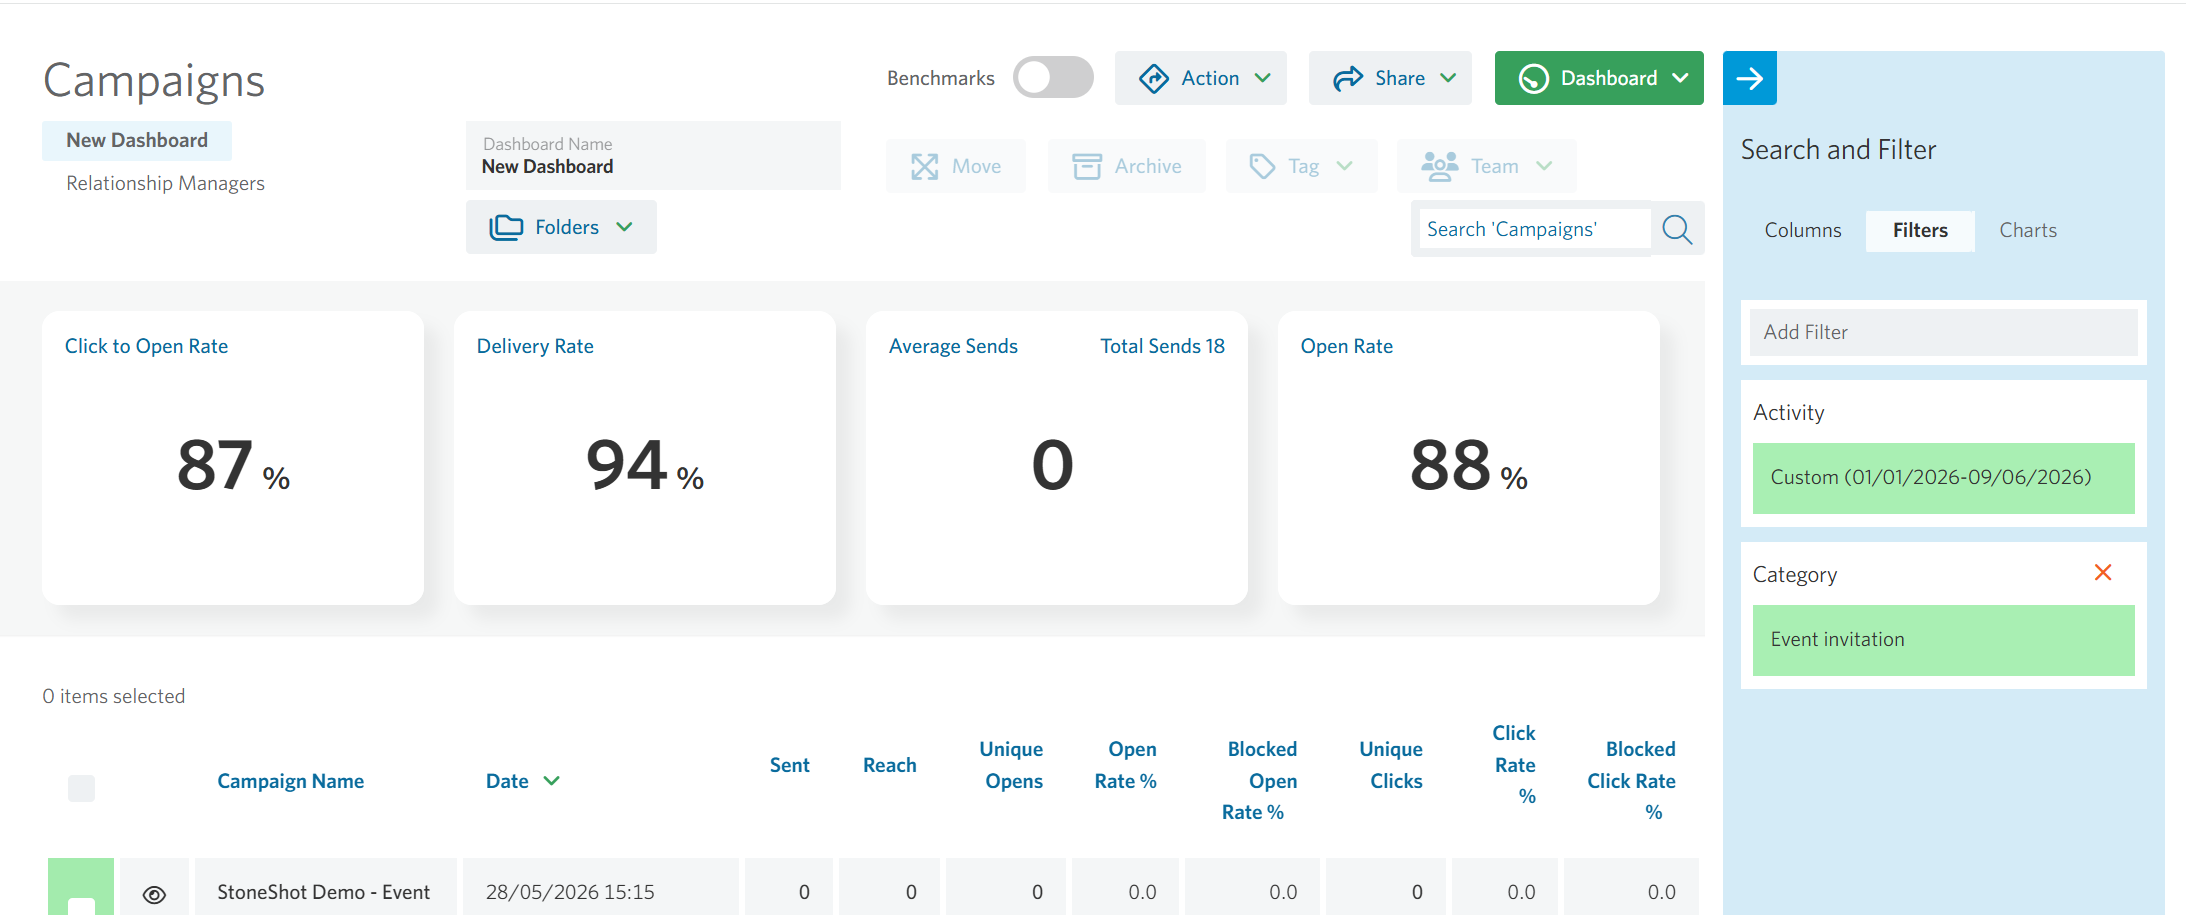
Our campaign reports homepage now gives you more control over the stats you want to see and allows you to easily access them with the new filter. You can create different dashboards, which you can customise with the information most important to you.
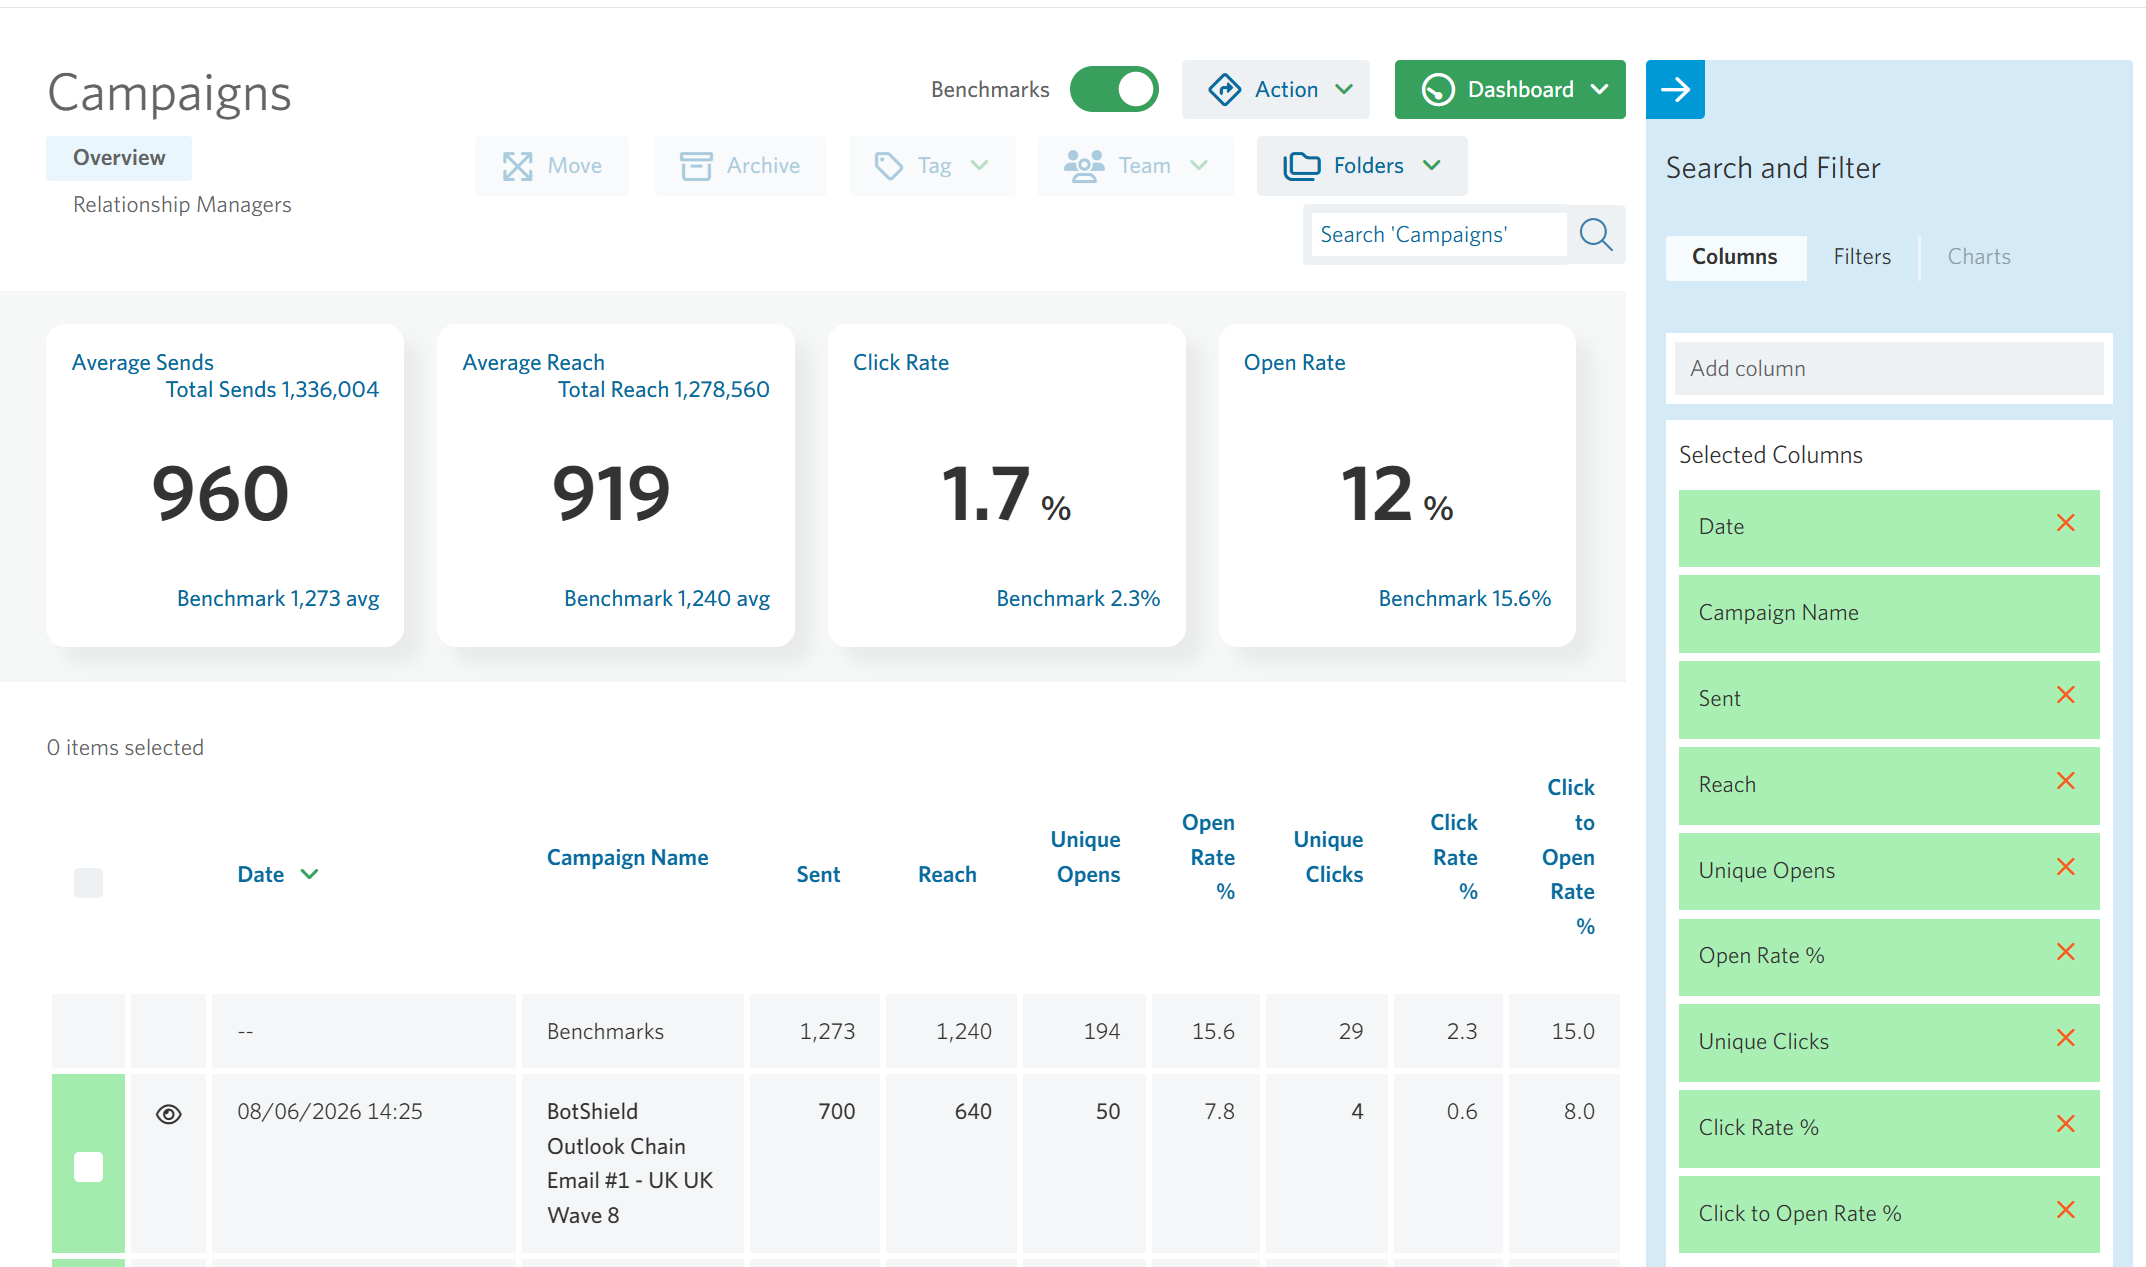
The first you’ll see is the average number of emails you send, average reach, click rate and open rate. On the right-hand side, you have various filter options that you can use to create the reports you’d like to read. You can filter your campaign by date range, audience, category, tags, creator of the event, team, reach or campaign code.
You also have a new comparison button which means you can compare your stats with the benchmark data we’ve gathered. The benchmarks shown match the filter set that you have selected and get saved with your dashboard.
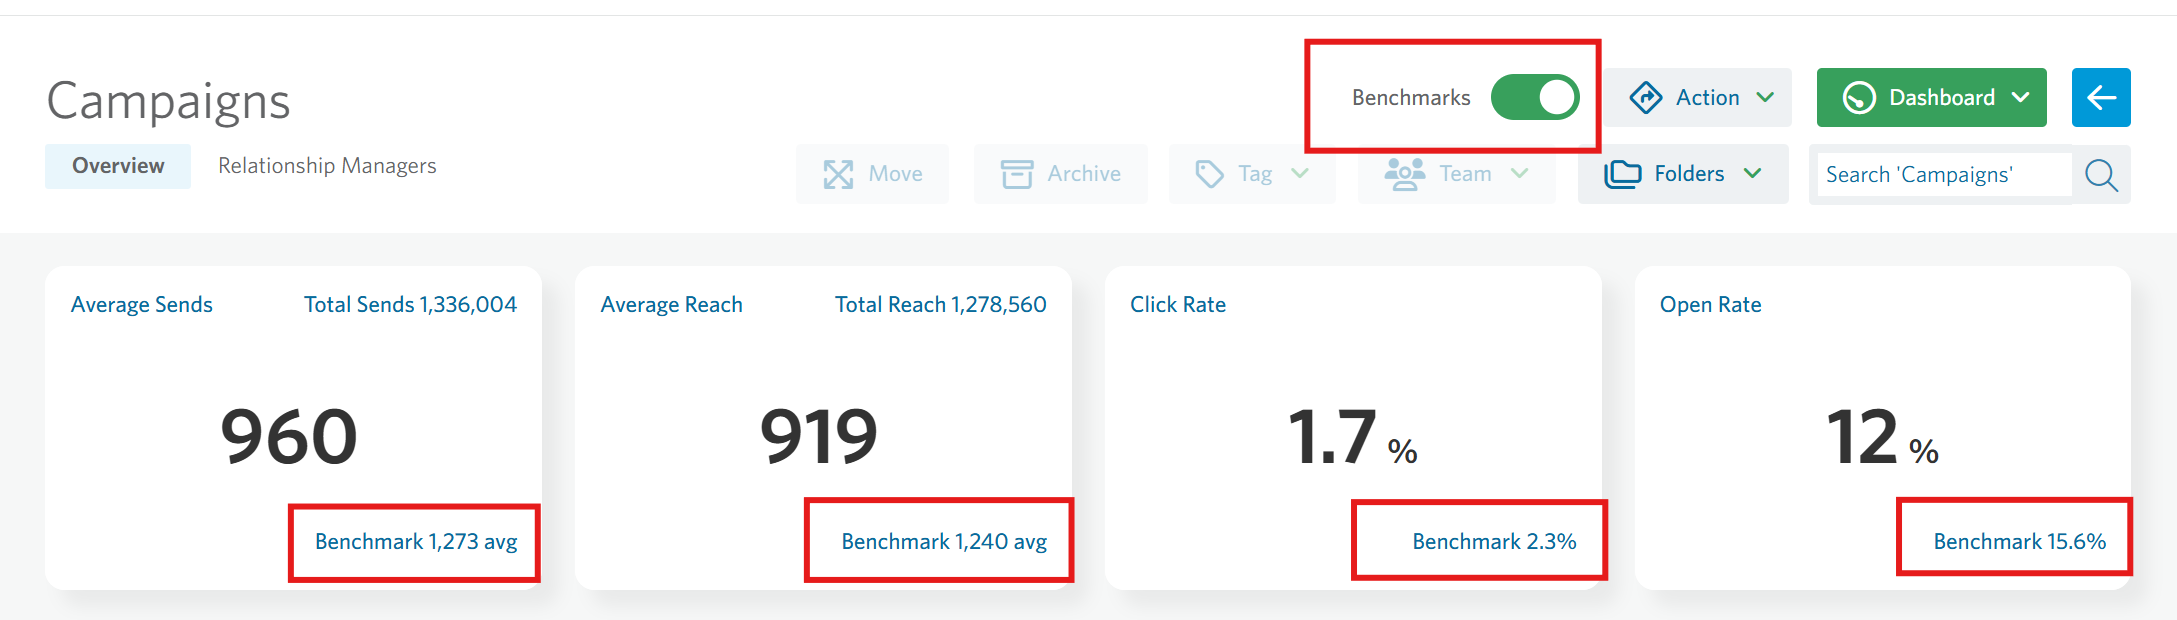
If you are working with a big team or have several big projects, you can create your own dashboard. Click the green button on the top-right corner to create a New Dashboard.
When creating a new dashboard, you can edit its name by expanding the blue edit panel. You’re able to select the stats you want to see on a regular basis, which you can edit as and when you need to using the filter, column and edit functions.
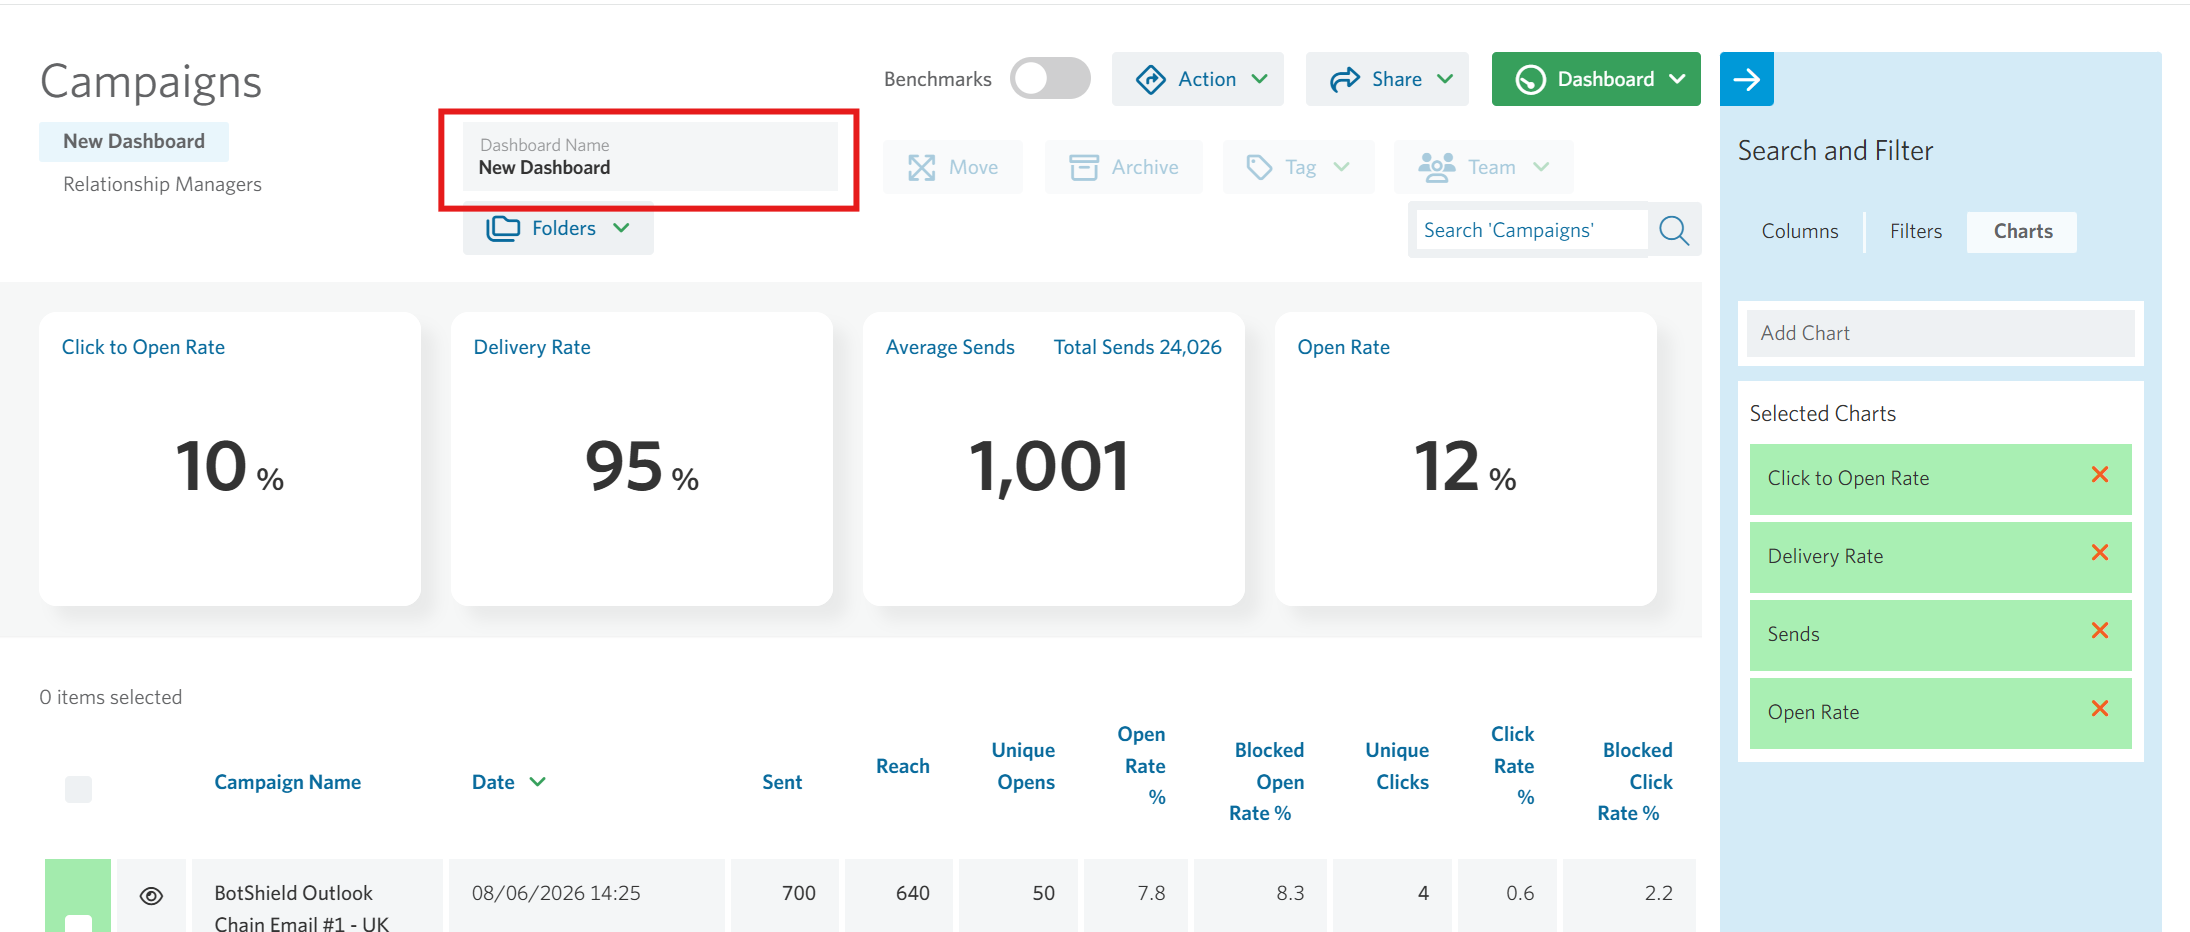
If you’ve decided to see all event invitations you have sent, change the category filter to Event Invitation and choose the stats you’d like to see. It will look something like this:
Sharing your dashboard
A useful feature is the ability to share your dashboard with your colleagues. You can use the Send button to send a pdf or csv version of your dashboard to anyone with an email address. This is useful for colleagues who don’t have access to StoneShot. You can do this as a one-off, or schedule a regular update to be emailed to your chosen contacts. This might be useful for keeping colleagues updated with an event mailing for example.
You can export the dashboard as a pdf or as a csv file for you to store and view offline by clicking on the Action button.
You’re also able to share your dashboard directly with other StoneShot users by clicking the ‘Share dashboard’ button and selecting your chosen users.
Individual emails
Once you find an email you’d like to individually check, open it and here’s how it will look like:
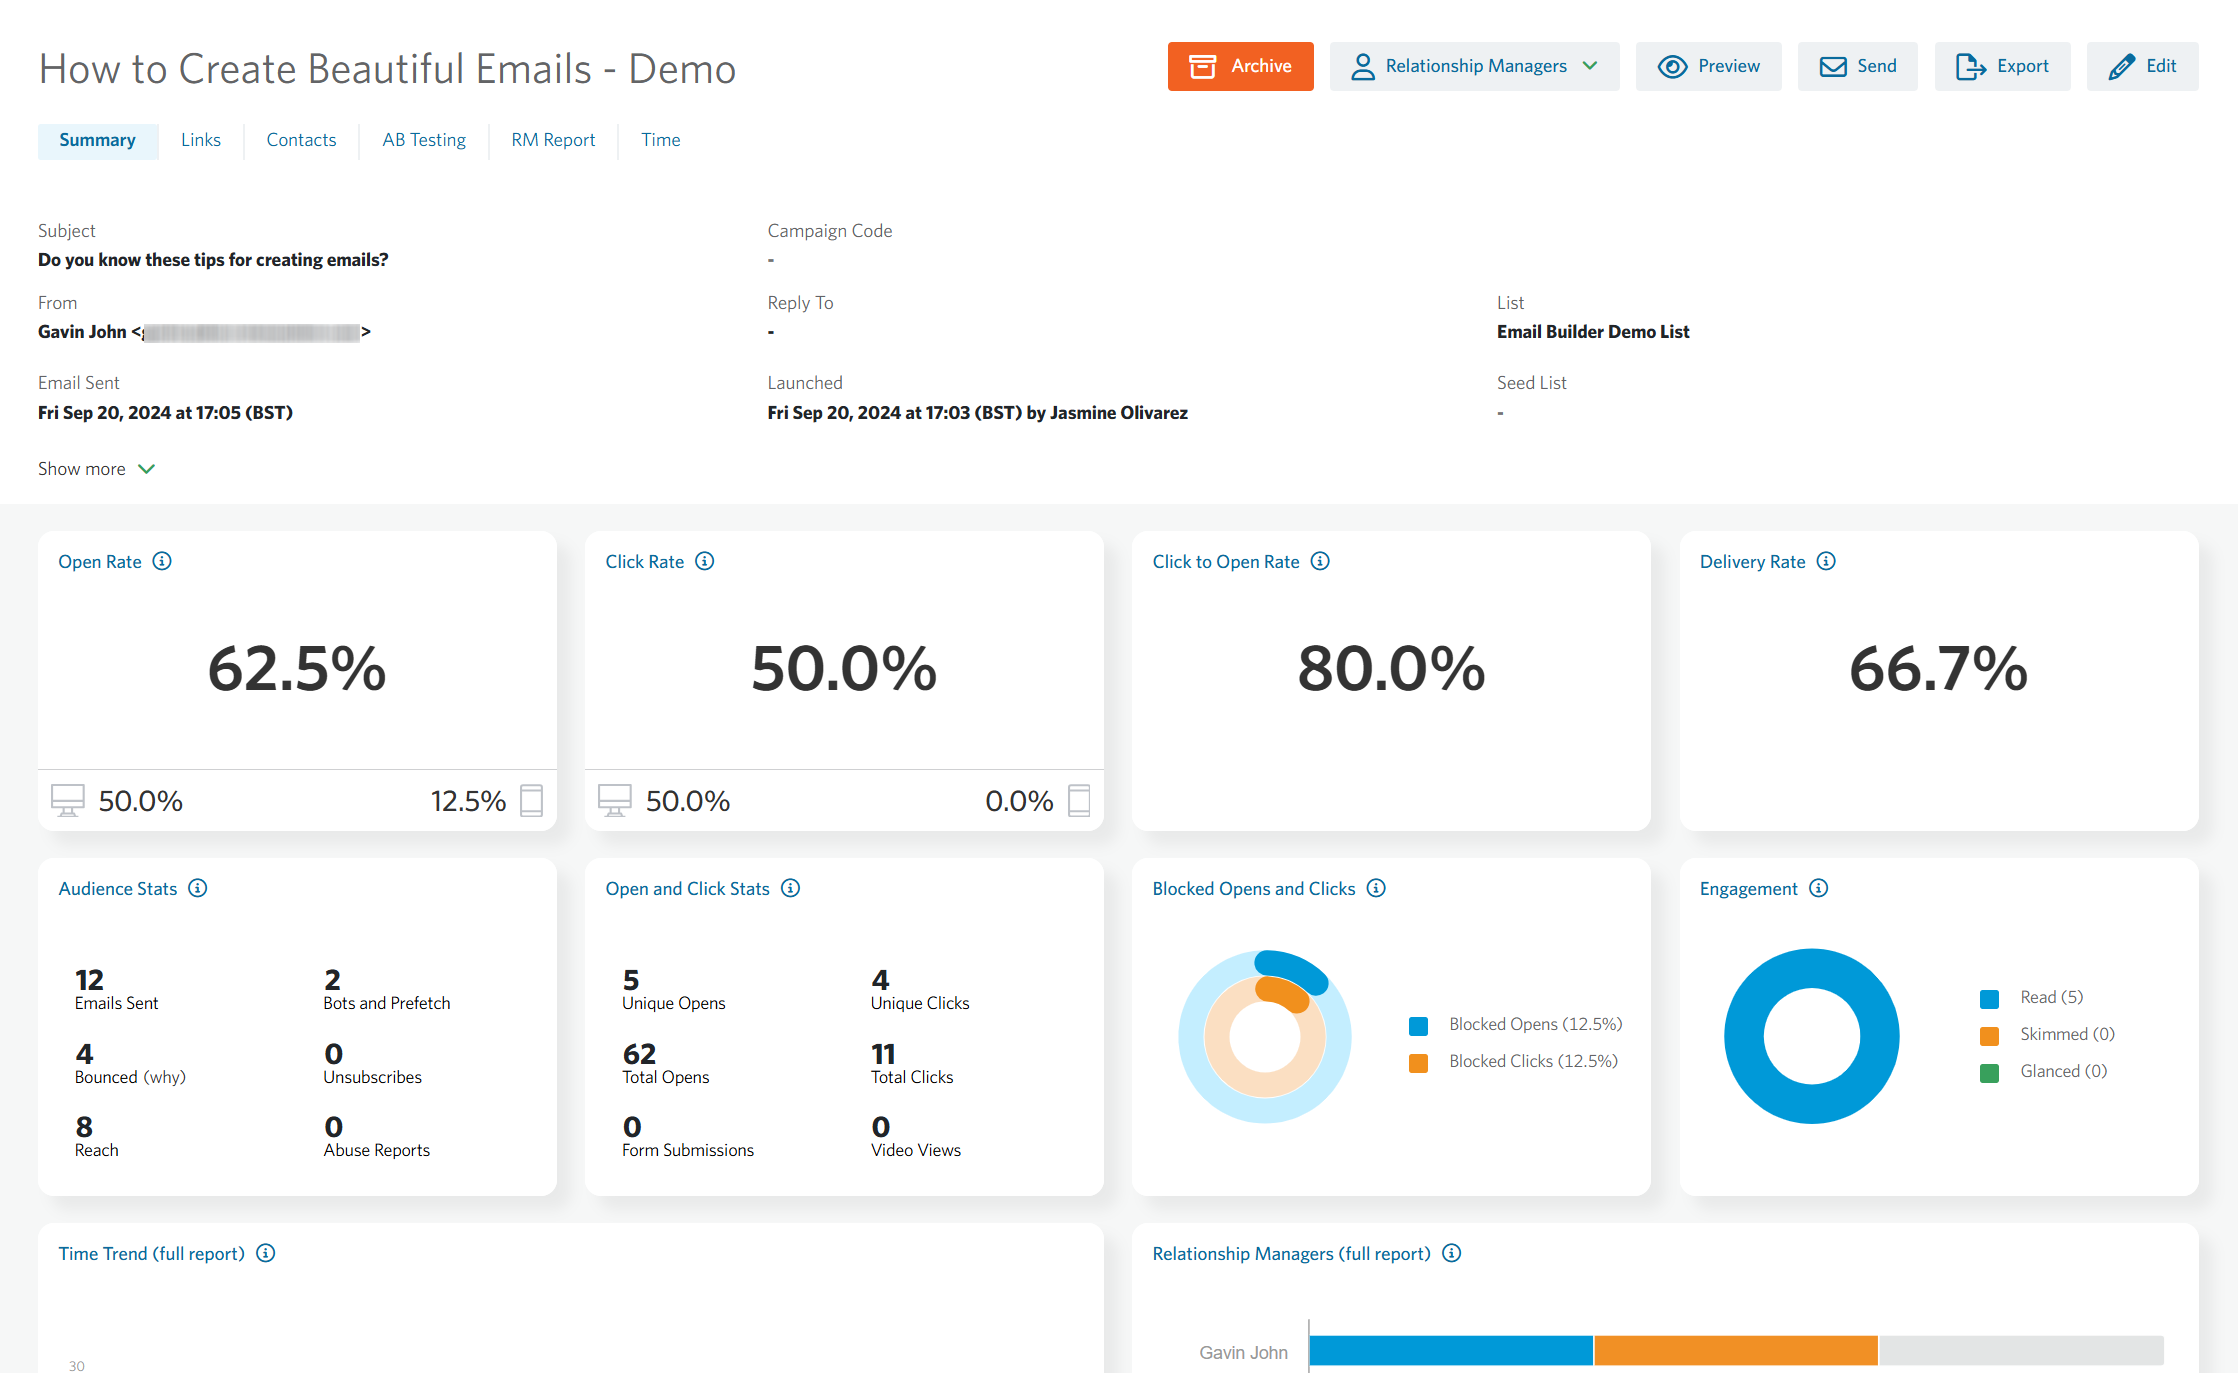
In here, you’ll find all the details and stats of your email.
Charts available
Here is a summary of the charts available when creating your dashboard.
- Sends – the average number of emails sent
- Reach – the average number of emails that were successfully sent and reached the contacts inbox
- Open Rate – the percentage of unique contacts who opened the email
- Click Rate – the percentage of unique contacts who clicked through on a link in your email
- Click to Open Rate – out of unique contacts who opened the email, the percentage that clicked through on a link in your email
- Delivery Rate – the percentage of unique contacts that were successfully sent and received the email
- Bounces – the average number of contacts that have bounced and didn’t receive the email
- Opt-Outs – the average number of contacts who have unsubscribed from your campaigns – excluding preference centre links
- Category – the total number of campaigns sent broken down by Campaign Category
- Audience – the total number of campaigns sent broken down by Audience Category
- Engagement – the breakdown of read engagement on all emails by percentage
- Devices – the breakdown of devices used to read all emails by percentage
- Most Popular Links – the five most-clicked links across all campaigns, ranked by total click count
- Time of Day Trend – an engagement breakdown by time of day across all campaigns
- Overall Stats – a summary of engagement metrics across all campaigns.
Filters available
Here is a summary of the filters available when creating your dashboard.
- Search box – search all campaigns by campaign name
- Time – the date range for your dashboard
- Audience – pick the audience category to filter down to
- Category – pick the campaign category to filter down to
- Tags – filter on tagged content
- Creator – filter on who launched the email campaign
- Event – filter down on campaigns associated to an event
- Team – filter the campaigns on the team they are allocated to
- Display data that has a reach of – restrict campaigns based on the amount of contacts it was sent to
- Campaign Code – filter campaigns using a shared campaign code to view the combined performance of related emails
Columns available
Here is a summary of the columns available when creating your dashboard.
- Audience – the audience category of the list used for your email campaign
- Bounce Rate % – the percentage of contacts that bounced
- Bounces – the number of contacts that bounced
- Click Rate % – the percentage of contacts that clicked through on a link
- Click to Open Rate % – out of unique contacts who opened the email, the percentage that clicked through on a link in your email
- Communication Type – the campaign category for your email campaign
- Date – when the email campaign launched
- Date Last Open/Click – the date of the last activity on your email campaign
- Delivery Rate % – the percentage of contacts that received the email campaign from your list
- Engagement Glanced (%) – the percentage of contacts who have opened the email for less than 2 seconds
- Engagement Read (%) – the percentage of contacts who have glanced the email for more than 8 seconds
- Engagement Skimmed (%) – the percentage of contacts who have glanced the email for between 2 and 8 seconds
- Form Submissions – how many contacts have submitted a form via the email
- Open Rate % – the percentage of contacts that opened the email
- Open Rate (Desktop) % – the percentage of contacts that opened the email on a desktop
- Open Rate (Mobile) % – the percentage of contacts that opened the email on a mobile
- Opt-Outs – the number of contacts who have unsubscribed via the email, excluding preference centres
- Reach – the number of contacts who received the email successfully
- Sent – the number of contacts who were sent the email
- Tags – the tags assigned to the email
- Total Clicks – the total amount of clicks on all links in the email. A contact can be in here more than once
- Total Clicks (Desktop) – the total amount of clicks on all links in the email from a desktop device. A contact can be in here more than once
- Total Clicks (Mobile) – the total amount of clicks on all links in the email from a mobile device. A contact can be in here more than once
- Total Opens – the total amount of opens for the email. A contact can be in here more than once
- Total Opens (Desktop) – the total amount of opens for the email from a desktop device. A contact can be in here more than once
- Total Opens (Mobile) – the total amount of opens for the email from a mobile device. A contact can be in here more than once
- Unique Clicks – the unique amount of clicks on all links in the email. A contact can be in here more than once
- Unique Clicks (Desktop) – the unique amount of clicks on all links in the email from a desktop device
- Unique Clicks (Mobile) – the unique amount of clicks on all links in the email from a mobile device
- Unique Opens – the unique amount of opens for the email
- Unique Opens (Desktop) – the unique amount of opens for the email from a desktop device
- Unique Opens (Mobile) – the unique amount of opens for the email from a mobile device
- Subject – the subject line used for the email campaign
- From Name – the sender name displayed to recipients in their inbox
- From Email – the sender email displayed to recipients in their inbox
- Preview – the preview (or preheader) text displayed alongside the subject line in supported email clients
- List – the recipient list the campaign was sent to
- Date Last Open/Click – the date and time of the most recent open or click recorded for the campaign
- Blocked Opens – the number of non-human opens identified and blocked by our BotShield technology
- Blocked Open Rate % – the percentage of non-human opens identified and blocked by our BotShield technology
- Blocked Clicks – the number of non-human clicks identified and blocked by our BotShield technology
- Blocked Click Rate % – the percentage of non-human activity identified and blocked by our BotShield technology
Campaign Summary
Your email stats and details can be seen in here. On the top of the page, you can see the name of your campaign, date and time delivered and details like the list the email was sent to and sender information. You can click on Show more to view more information on your campaign.
On the top-right corner, you’ll be able to download a complete PDF or Excel report of the campaign, visualise the HTML and text version sent, share or archive it. You’ll also find an Edit button in case you’ll need to change the campaign’s name, category, tags or link it to an event.

In the main campaign report page, you’ll also be able to see the open, click, click to open and delivery rates (which will also have a device comparison, so you can see how contacts are reading your emails). There is a 24-hour performance report and the overall stats of your email. Here you’ll be able to check your specific stats: sent, reached, opened, clicked, form submissions, video views, unsubscribes, bounces and abuse reports.
*these graphs and totals are clickable. If you click the highlighted totals, you will be taken to the contact list of the stat.
Here is a description of each category in the Overall campaign stats section:
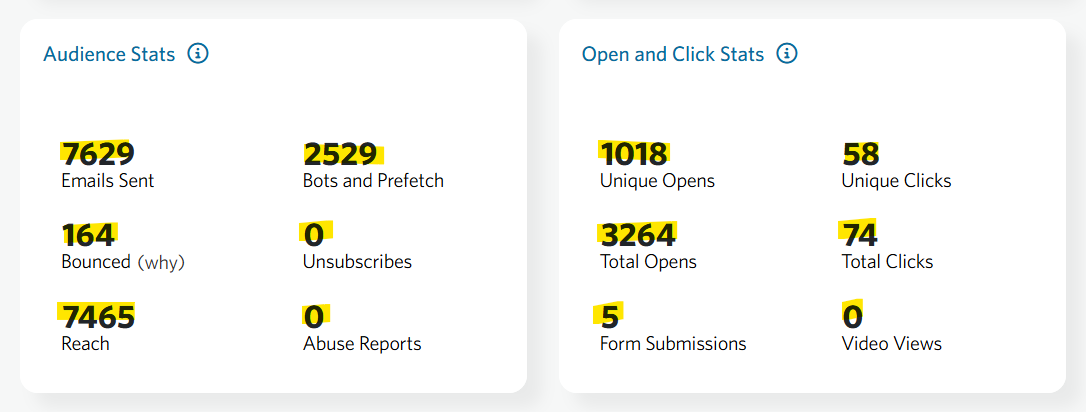
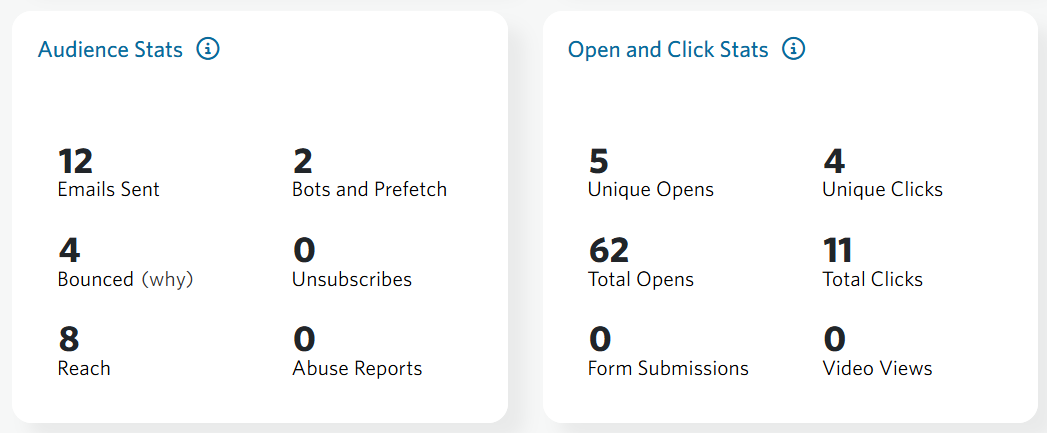
- Emails Sent – number of emails sent
- Reach – number of emails that were successfully sent and reached the contacts inbox
- Unique Opens – number of unique contacts who opened the email – excludes opens generated by image prefetching or preloading
- Total Opens – the total number of email opens, including multiple opens by the same recipient
- Unique Clicks – number of unique contacts who clicked through on a link in your email – clicks from link scanners will be suppressed
- Total Clicks – the total number of email clicks, including multiple clicks by the same recipient
- Form Submissions – if you have a form linked in your email, the number of unique contacts who submitted the form via the email (e.g a preference centre or a registration form)
- Video Views – If you have linked to any videos in your email, you’ll see the unique number of contacts who have clicked through to your video. This will only be shown if you have one of our video APIs connected to your account
- Unsubscribes – number of unique contacts who have unsubscribed/ opted out of receiving emails
- Bounced – number of unique contacts that have bounced and were not able to be delivered to the contacts inbox
- Abuse Reports – number of unique contacts who have marked your email as spam. These should be investigated and followed up separately
- Bots and Prefetch – non-human activity identified and excluded from engagement metrics
We also display the most popular links on your campaign, which are the links with the highest total clicks; Contacts with most opens, which devices the contacts used to open the emails and a breakdown of the contacts engagement (did they read the email, skim it or glance through the email?).
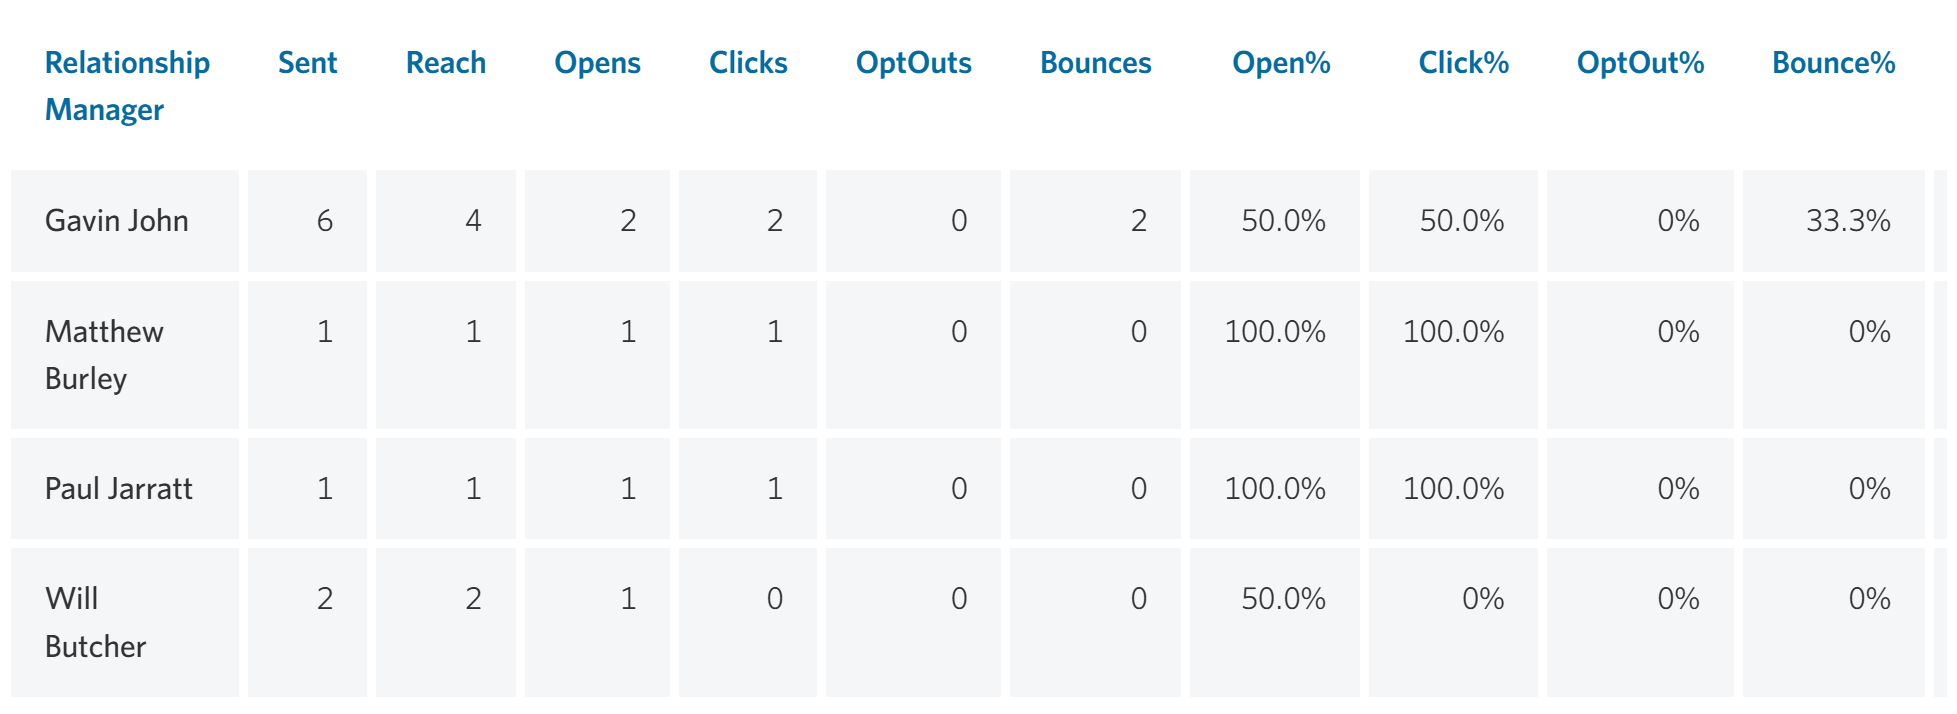
Relationship Managers
The reporting page shows you the engagement for the top Sales/ Relationship Managers. You can still access the full report if you click the Full report link.
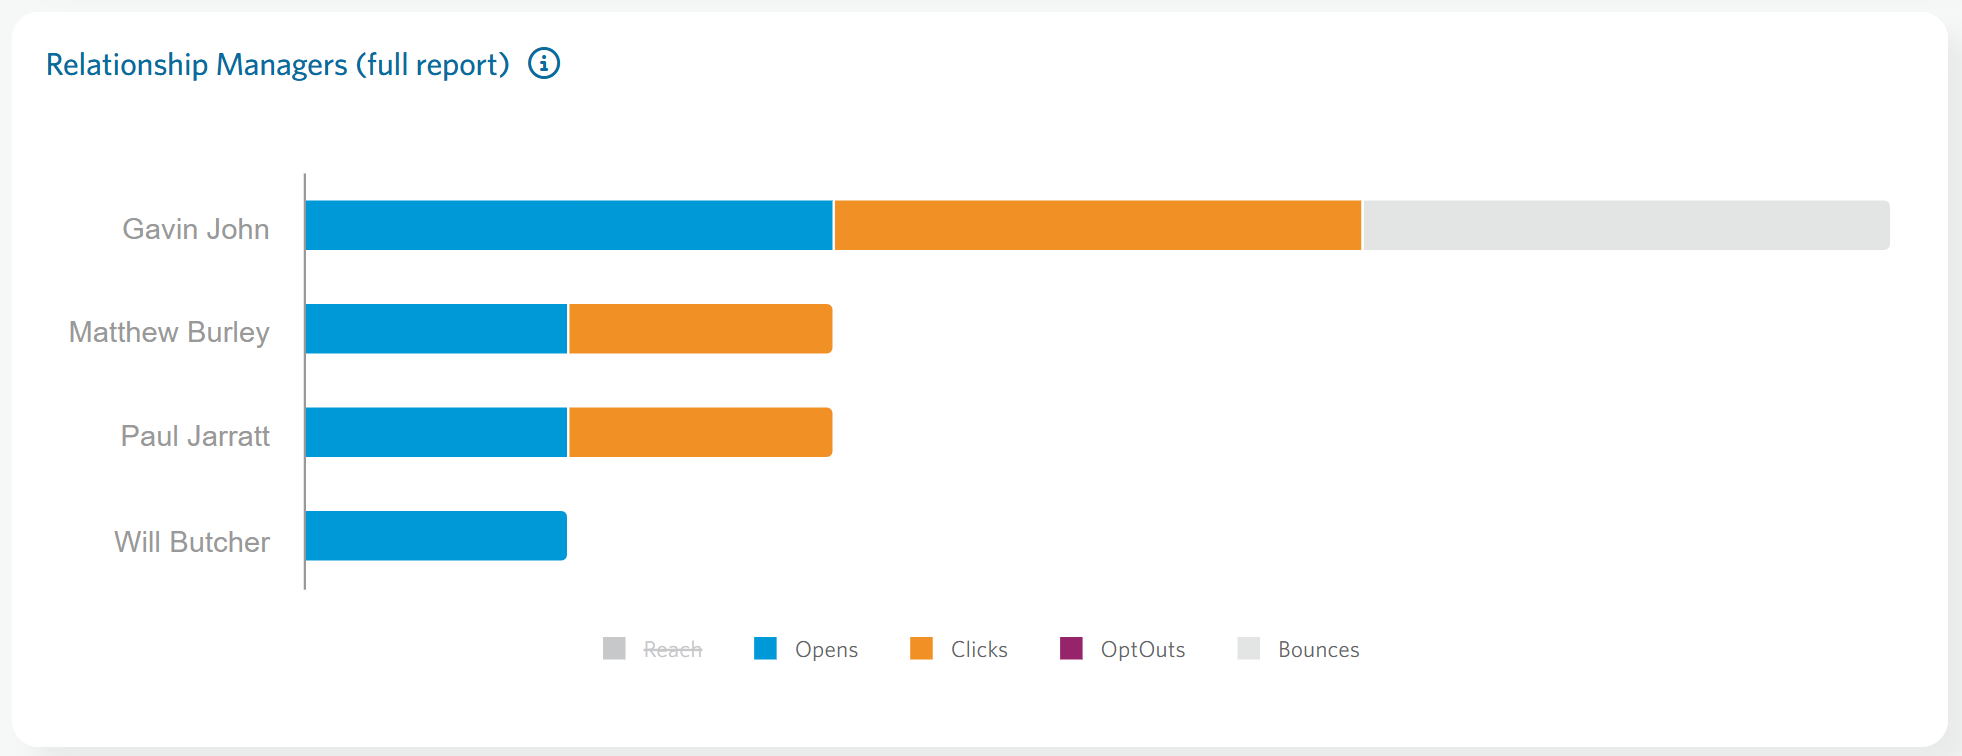
This will show you all the contacts with a relationship manager. If you don’t have any, this section will be empty.
When you click through to full report, you’ll be able to see all activity separated by relationship manager. You can see how many emails were sent, reached, opened and clicked. You can also see how many people opted out and bounced back.
You can export a pdf for an individual Relationship manager by clicking on their name, or pdfs for all the relationship managers by clicking Export Page.
Links
The link tab will show you the breakdown of the links and clicks in the email. You can see where the links were in the email, as well as how many people clicked on them. Clicks from link scanners will be suppressed.
At the very end of the page, you have the links URL breakdown and their unique clicks. If you click in the highlighted number on the right side of the URL, you will be redirected to a list of contacts who clicked on it.
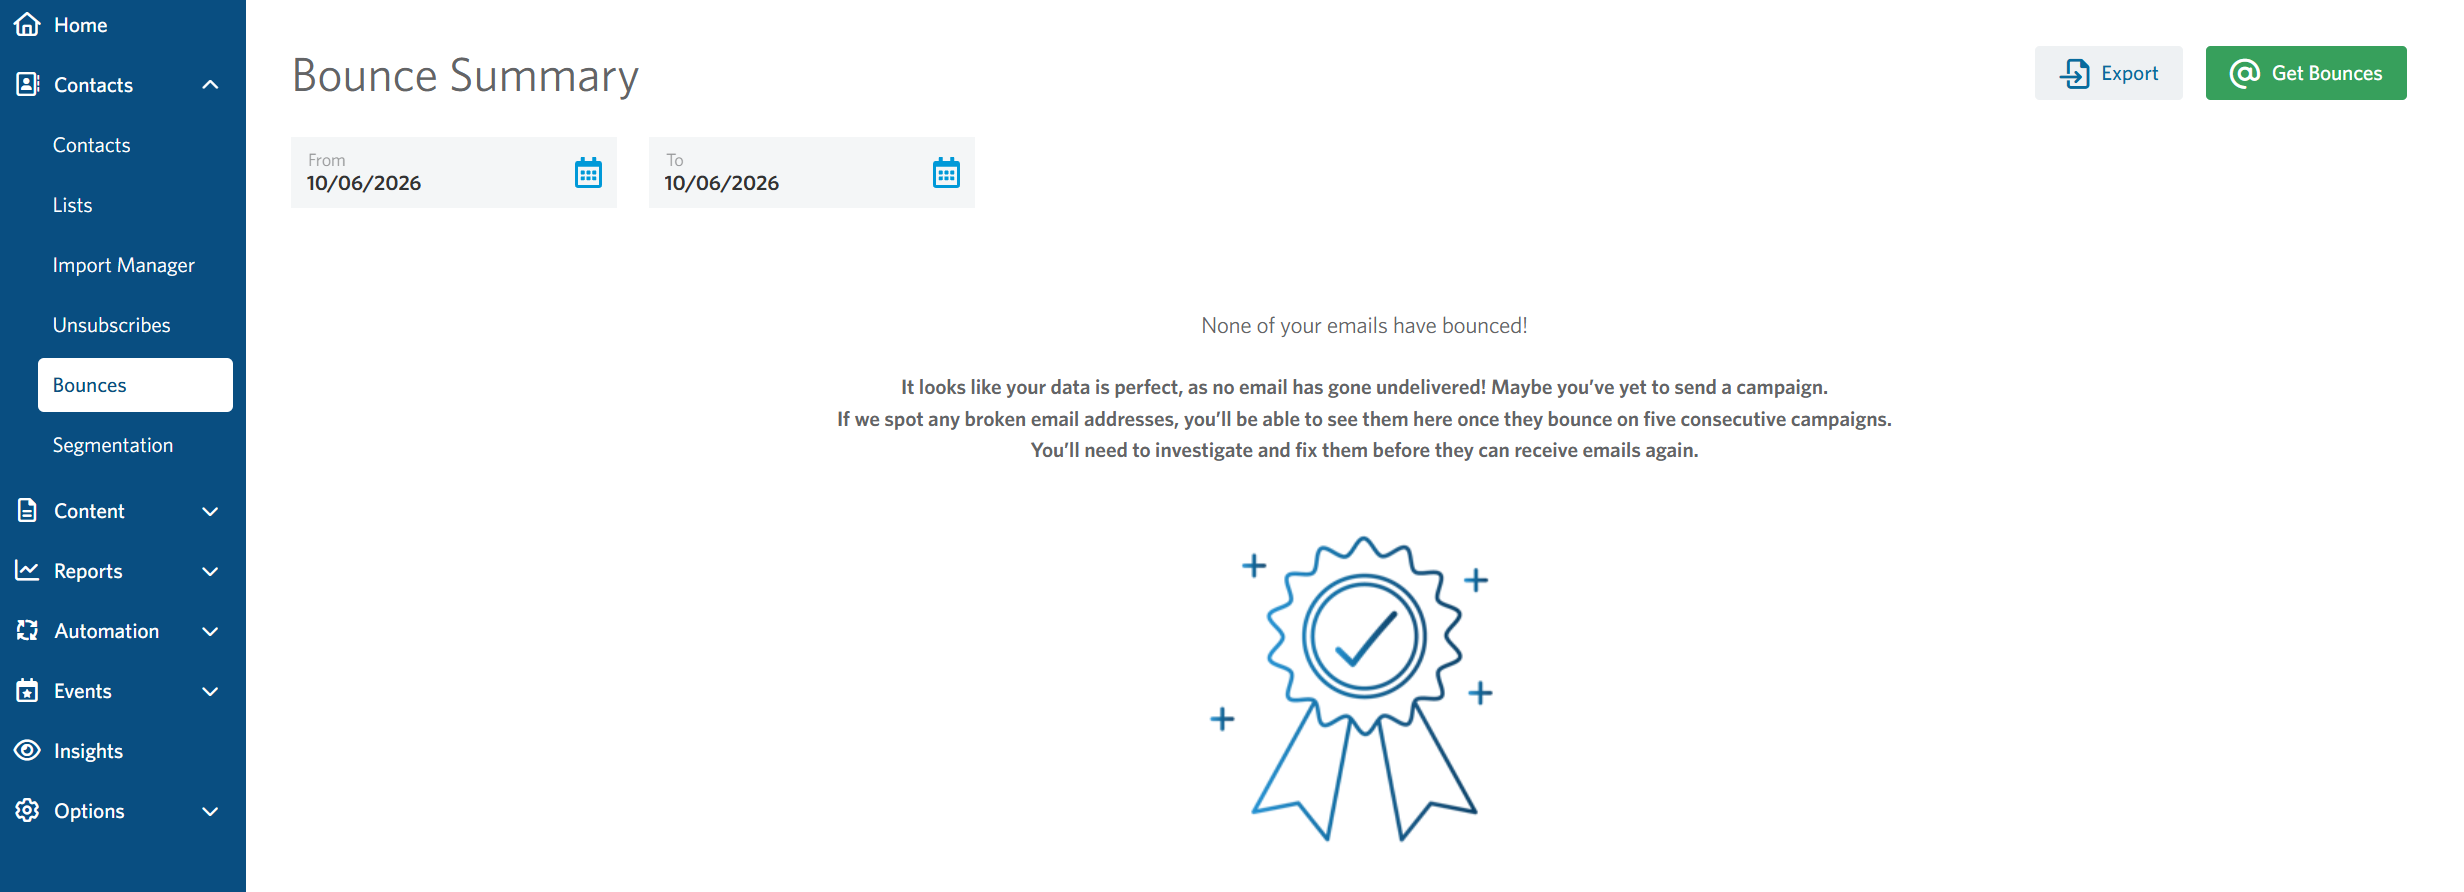
Bounces
If you have any bounces and want to examine them, the Bounces tab will be extremely helpful. Here you can see the amount of bounces, if they were soft, general or hard bounces and the amount of contacts in those categories.
You can also extract a report of the bounces by clicking on the top-left Export button. This report will contain the individual contacts and their bounce reason.
Time
This chart shows campaign activity over the Day, Week or Month after launch.
We’ve stacked up Opens, Clicks and Unsubscribes to give you the total activity in the given hour or day.
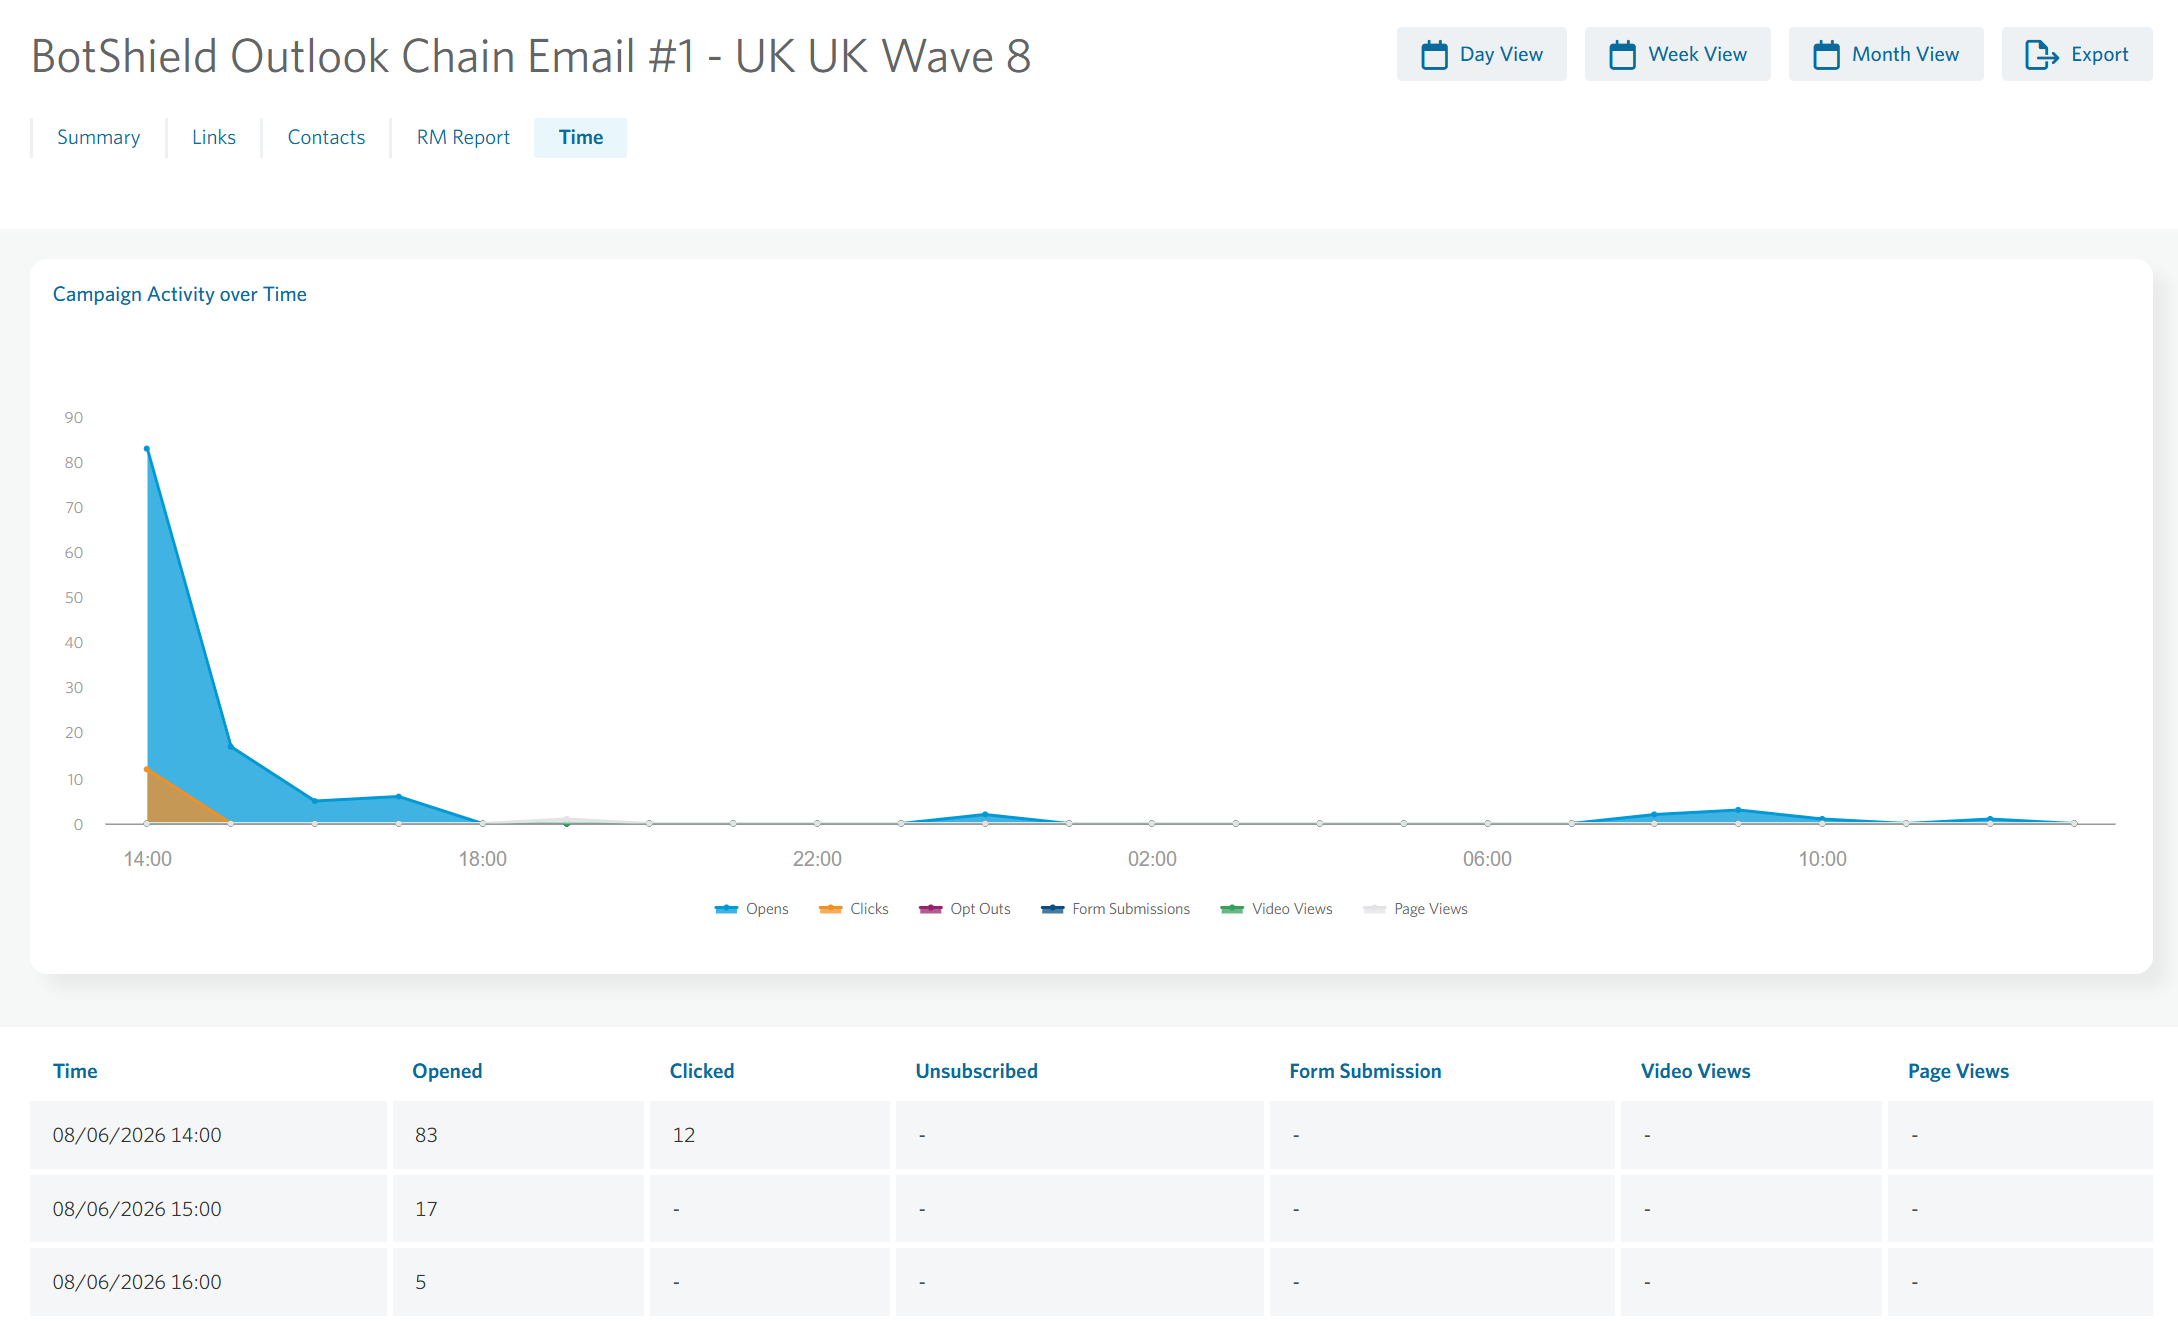
The table gives you the stats for copying and pasting into your own reporting tool. You can also export this report as an excel file by clicking the export button on the top-right corner. You can click on each item in the chart key (Opened, Clicked, Unsubscribed, Form Submissions, Video Views) to add or remove them from the chart.
Contacts
You can see all individual activity of the campaign. You can also export this report as an excel file by clicking the green export button on the top-left corner. The report will give you details of who’s activity this is, when it happened, which device and their engagement type.
FAQ
What’s the difference between a soft and hard bounce?
A soft bounce is likely caused by a temporary block such as a full mailbox or temporary server issue. A hard bounce is more likely permanent such as an invalid email address. More info can be found on our Bounce meanings page
Why does my campaign have some removed/dropped contacts?
It can be for multiple reasons but the most common one is the segment is missing an information in StoneShot. More information can be found on our Troubleshooting Campaigns page
Why does a scheduled email in the campaign report not show the scheduled date?
The campaign report will show the Launched date of the time the schedule was set, not when it was triggered